
In Power BI, the ability to effectively communicate insights from data visualizations is crucial, and one powerful feature that enhances this communication is the incorporation of data labels.
Data labels provide a direct and informative way to display specific data points within visualizations, offering context and clarity to the audience.
Whether working with charts, maps, or other graphical representations, adding data labels allows users to directly associate values with corresponding elements. This thereby facilitates a more intuitive understanding of the underlying data.
This post will guide you on effectively adding data labels to visuals in Power BI, empowering you to enhance the quality and readability of your visualizations.
Why are Data Labels Important?
Data labels are essential in Power BI for clarity and context in visualizations, comparisons, and accessibility. They display actual values on visualizations, aiding comprehension and identification of trends. Personalization options further enhance data understanding.
Other benefits of using data labels in Power BI include the following.
- Improved Data Interpretation: By presenting values in charts and graphs, data labels simplify data interpretation and comprehension.
- Enhanced Communication: Data labels convey precise values thereby aiding users to easily understand the information.
- Increased Accuracy: Data labels ensure accurate representation of data points which prevents misinterpretation.
- Data Comparison: Data labels allow direct value comparison in visualizations possible. This facilitates better analysis and decision-making.
- Accessibility: Data labels enhance visualization accessibility for individuals with visual impairments by providing a textual representation of the data.
Essentially, integrating data labels in Power BI enhances data understanding and accessibility.
Add Data Labels to Visual
Data labels in Power BI provide a formatting option for displaying data within visualizations. By adding data labels, you can format the display to include specific values or labels directly on the visual elements. This enhances the overall presentation and makes it easier to interpret the data.
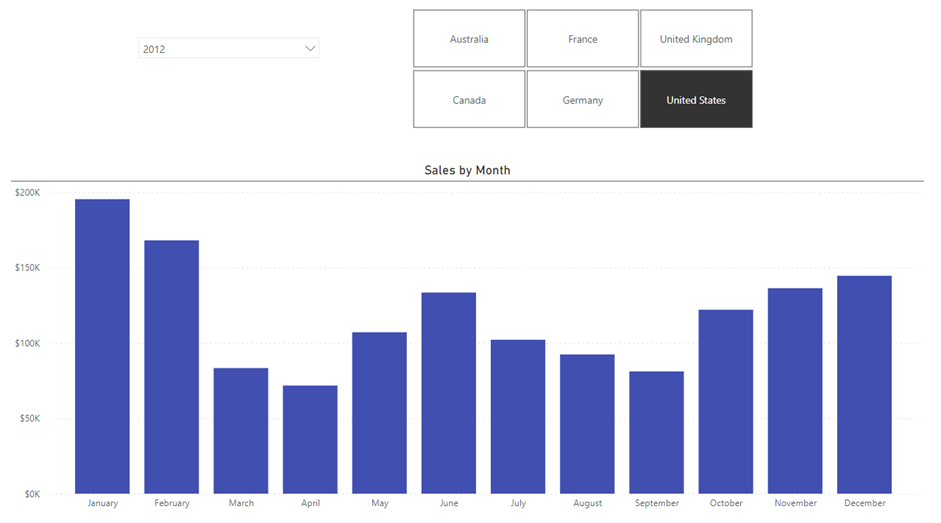
The visual above uses a column chart to illustrate the monthly sales of the United States in 2012. While the height of the bars provides a general understanding of the sales volume for each month, adding the actual values through data labels offers a more precise interpretation of the columns.

To easily add data labels, just click on the desired visual to select it. Then, navigate to the Format your visual tab in the Visualizations pane and toggle the Data labels option to On. Power BI will add a default Data Label format to the selected visual as seen in the image above.

To modify the label appearance on the chart, utilize the Options, Values, and Background dropdown options. These menus offer the flexibility to adjust label position, font size and type, color, background color, and unit value.
Add Label to Visual with DAX
One significant advantage of utilizing DAX in Power BI is the ability to enhance your data visualizations with informative labels. By strategically employing Data Analysis Expressions (DAX), you can amplify the depth and clarity of your insights.
Unlike traditional static data labels, DAX-driven labels overcome limitations by dynamically updating and adapting to changes in the underlying data or filter selections.
This dynamic labelling technique promotes a more interactive and insightful visualization experience, helping users to better understand the data.
Add Custom Labels
To create custom labels using DAX, first, you will create a DAX measure. You can customize the measure to return anything you want displayed on the visual as the data label.

VAR Year = SELECTEDVALUE( DimDate[CalendarYear] )
VAR Month = SELECTEDVALUE( DimDate[EnglishMonthName] )
VAR SalesValue = [Total Sales]

Return

LEFT(Month, 3) &"-"& Year &" || "& FORMAT(SalesValue, "$0,000")
The syntax uses three variables to yield precise values. The Year variable retrieves the present year based on the slicer selection, while the Month variable provides the month name for each category in the chart. This functionality is made possible by utilizing the SELECTEDVALUE function.
The SELECTEDVALUE function retrieves the value of a column that has been filtered down to a single distinct value. Otherwise, it returns a blank or a specified alternate result.
SELECTEDVALUE ( <columnName> [, <alternateResult> ] )- columnName – the name of an existing column, using standard DAX syntax. It cannot be an expression.
- alternateResult [Optional] – the value returned when the context for columnName has been filtered down to zero or more than one distinct value. When not provided, it returns a blank.
The SalesValue variable simply holds the value of the [Total Sales] measure.
The Return keyword starts the output of the DAX expression.
This line constructs a text string using the variables defined earlier. It takes the left three characters of the Month variable), appends a hyphen and the Year, then adds a separator (“||”), and finally formats the SalesValue using a specified currency format.

Now that you have the needed measure, you need to add it to the visual. To do this, follow these steps:
- Select the visual you want to add to the custom label.
- In the Visuals tab, click on Data Labels.
- Click on Values and toggle the Custom label option to On. This will make the Field box active.
- Add the custom label measure to the field by dragging and dropping.

Go to the Options menu and choose the Inside end position for the label.

When you’re done, the visual will carry the new customized labels, displaying the values exactly as defined in the DAX measure.
Add Smart Labels
Smart data labels in Power BI also offer a dynamic and intelligent approach to presenting vital information. They can adapt as filters change, highlighting important information and identifying emerging trends and relationships.
With smart labels, you can optimize your reports and dashboards for precise representation of critical data points. To create a smart data label, you also need to create a measure.
For instance, assuming you want your labels to change appearance based on a specific threshold, you simply need to create a measure that will format the values based on the benchmark and use it as a conditional format for the visual.

Smart Label =
VAR HighNumbers = [Total Sales] >= 150000
VAR LowNumbers = [Total Sales] <= 150000

Return
SWITCH(
    TRUE(),
    HighNumbers, "RGBA(0,225,0,1)",
    LowNumbers, "RGBA(255,0,0,1)"
)
This measure assesses if the sales value exceeds or falls below 150,000. Using the SWITCH function, values above 150,000 will be displayed in green, while those below will be shown in red.
The SWITCH function evaluates an expression against a list of values and returns one of multiple possible result expressions. It offers a more elegant alternative to writing multiple IF statements. While the SWITCH functiin doesn’t replace the IF function, it proves highly effective in most scenarios.
SWITCH(<expression>, <value>, <result>[, <value>, <result>]…[, <else>])- expression – a DAX expression that yields a single scalar value that is evaluated multiple times for each row/context.
- value – a constant value to be compared with the results of the expression.
- result – a scalar expression to be evaluated if the results of the expression match the corresponding value.
- else – a scalar expression to be evaluated if the result of the expression does not match any of the value arguments.
In this measure, the TRUE() function returns the logical true. If the condition associated with HighNumbers is true, the function returns the color green. If the condition associated with LowNumbers is true, it returns the color red.
With this measure, you will have created a simple yet effective approach for highlighting crucial information on your chart.

After creating the measure, you just need to add it to the visual. To do this, first select the chart you want to use, then go to the Values option under Data labels and click on the fx button in Color.

In the Color–Series window, choose the Field value option in the Format style option. As for the What field should we base this on? option, add the label measure created earlier. Click on the OK button to save the changes.

Once finished, you can quickly observe the color-coded numbers on the chart, reflecting the conditions specified in the labelling measure. For example, a brief look reveals that sales in four out of twelve months fell short of 150,000.
Data Label Best Practices
Data labels in Power BI serve as valuable tools for enriching data visualization and facilitating analysis. However, their indiscriminate application can lead to cluttered charts which can cause misunderstanding and confusion in the users.
To avoid this, here are some established best practices you can follow to ensure the use of data labels effectively.
1. Avoiding Chart Clutter:
- Prioritize relevant data points to limit displayed labels, preventing information overload.
- Use tooltips or drill-through features for additional details, keeping the chart uncluttered.
- Consider data bars or icons for clear visual representation, especially for specific data types.
- Group similar data points to improve visual organization and readability.
- Ensure label clarity and readability by employing line breaks or text wrapping, if necessary.
2. Prioritizing Clarity and Conciseness:
- Keep it brief: Use concise language to convey information and avoid confusion.
- Accuracy matters: Ensure labels reflect data accurately to build trust.
- Choose a legible font for easy readability.
- Use visual cues like color or icons to enhance clarity and guide attention.
3. Using Diverse Colors and Fonts:
- Color Harmony: Match data label colors with the overall design and data for visual coherence and brand consistency.
- Contrast for Clarity: Choose contrasting colors to make labels stand out for better visibility and readability.
- Emphasizing Importance: Use bold or larger fonts for crucial labels to draw attention and highlight key information.
- Balancing Act: Avoid overcrowding by spacing out labels and using smaller fonts when necessary to maintain visual balance and prevent clutter.
- Experimentation: Try different font styles to create a visual hierarchy and highlight critical information, catering to diverse learning styles and preferences.
Some things to avoid include:
1. Overlapping Labels: to prevent overlapping labels, here are some things you can do:
- Chart Size Expansion: Increase overall chart dimensions to create more space, mitigating label overlap.
- Label Rotation: Strategically rotate labels to vertical or diagonal orientations, especially in densely populated charts, to minimize overlap.
- Key Data Point Emphasis: Prioritize labels for essential data points and consider using hover-over features for additional details, balancing clarity, and information depth.
- Data Filtering: Reduce the number of data points through judicious filtering to directly address label overlap and ensure optimal readability.
- Experimentation: Encourage exploration of various combinations of label placement, font sizes, and formatting options to discover the most visually effective presentation for each unique chart.
2. Inconsistent Label Formatting: to ensure consistency and clarity, do the following:
- Use a Style Guide: Create a comprehensive formatting style guide covering font type, size, color, and alignment for a cohesive visual language.
- Apply Style Uniformly: Apply the established style guide consistently across all visualizations in a Power BI report to prevent misinterpretation and foster clarity.
- Regular Review and Maintenance: Schedule periodic reviews and updates to label formatting, especially with new data, to maintain consistency and align with evolving data patterns.
- Use Conditional Formatting for Emphasis: Use conditional formatting strategically to highlight specific data points or values, directing the viewer attention to key insights.
- Test Run Thoroughly: Conduct thorough testing of visualizations to ensure label legibility and prevent overlap with other visual elements, guaranteeing a seamless user experience.
By adhering to these best practices, you can harness the power of data labels in Power BI to create visualizations that not only improve comprehension for the user but also create an aesthetically pleasing dashboard or report.
These guidelines can help you ensure that your data labels enhance, rather than hinder, the communication of insights within your Power BI reports.
Conclusion
Data labels serve as a potent tool for elevating the clarity and informativeness of your Power BI visualizations. Their high level of customizability ensures that you’re not confined to static labels.
However, there is a risk of overcrowding your reports with data labels, but adhering to best practices can ensure that your labels are well-formatted, thoughtfully positioned, and offer valuable insights to your audience.


0 Comments