
Do you want to find a month-to-date total in Power BI?
Calculating Month-to-Date (MTD) values in Power BI provides valuable insights for analyzing data trends and monitoring performance over a specific period within the ongoing month.
MTD calculations allow you to evaluate cumulative values for a particular measure or metric from the beginning of the month up to the current date. By leveraging Power BI’s flexible and robust DAX time intelligence function, you can efficiently compute MTD values.
In this post, you will learn various step-by-step approaches to calculate the Month-to-Date values in Power BI, enabling you to gain deeper visibility into your data and effectively track progress throughout the month.
Getting a Date Table
Accurately performing the MTD calculation necessitates the use of time intelligence functions in Power BI. For this, a dedicated date table in your data model is required. However, several conditions must first be met to ensure precision and avoid errors.
Consequently, the date table must:
- contain every day for all years within your fact table.
- have at least one field set as a Date or DateTime datatype.
- only contain unique date or datetime values, without repetition.
- be marked as a date table (best practice).
You can create a date table in Power BI using the Power Query editor or DAX’s CALENDAR OR CALENDARAUTO function.
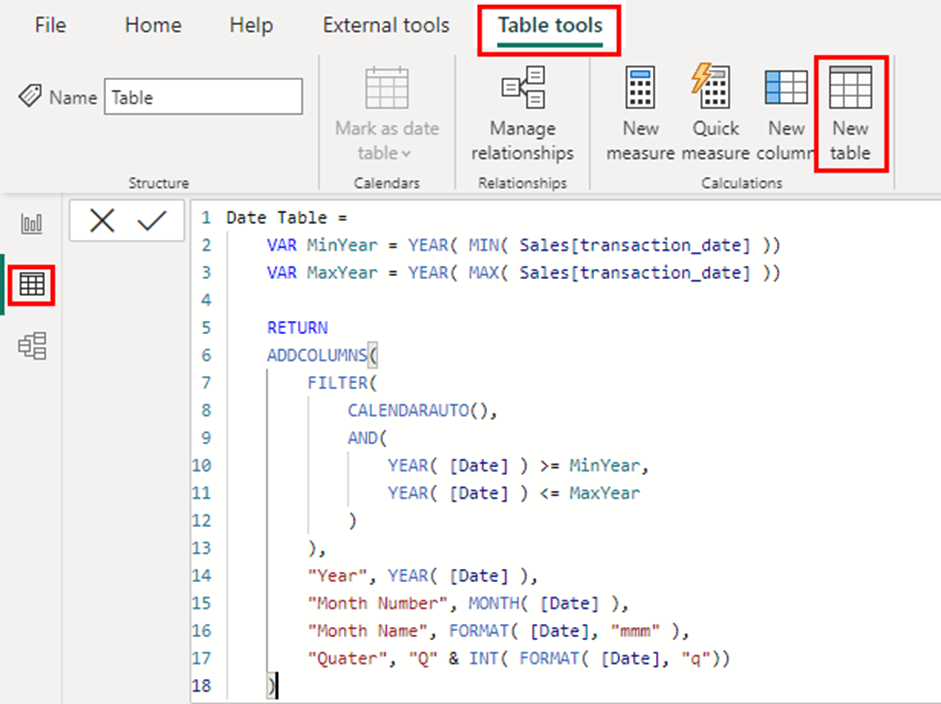
Date Table =
    VAR MinYear = YEAR( MIN( Sales[transaction_date] ))
    VAR MaxYear = YEAR( MAX( Sales[transaction_date] ))

    RETURN
    ADDCOLUMNS(
        FILTER(
            CALENDARAUTO(),
            AND(
                YEAR( [Date] ) >= MinYear,
                YEAR( [Date] ) <= MaxYear
            )
        ),
        "Year", YEAR( [Date] ),
        "Month Number", MONTH( [Date] ),
        "Month Name", FORMAT( [Date], "mmm" ),
        "Quater", "Q" & INT( FORMAT( [Date], "q"))
    )
If your data doesn’t come with a date table, you can use this syntax to create one quickly and easily. To use the syntax, go to the Data view in Power BI, click on Table tools, and select the New table option.
The syntax is dynamic and reusable syntax, and it only requires you to change the date column name to reflect the date column in your data set.
Creating a date table with this method eliminates the need to manually extract date components into separate columns, something Power Query can’t do. This approach is more efficient and saves time and effort, whilst delivering equivalent results.
Now that you have created a date table, you can proceed with creating the MTD measure. You can do this in various time intelligence functions which will be highlighted in the following paragraphs.
Calculate Month to Date Using TOTALMTD
The TOTALMTD function is a time intelligence tool that calculates monthly totals, such as sales or revenue. It evaluates the monthly totals over an interval that begins on the first day of the month and ends on the last date of the month.
The TOTALMTD syntax uses three parameters:
TOTALMTD ( <Expression>, <Dates>, [<Filter>] )<Expression>– an expression returning a scalar value that will be evaluated for every date provided in the current filter context.<Dates>– a column that contains dates or an expression that returns a one-column date table.[<Filter>]– an expression that specifies the filter that will modify the current context.

MTD (TOTALMTD) =
    TOTALMTD (
        [Sales],
        'Date'[Transaction_Date]
    )
Use this syntax to calculate the month-to-date value. It’s a very straightforward syntax that calculates the month-to-date sales for every date provided in the ‘Date’[Transaction_Date] column.

When you add the measure to a visual, you can see that the measure returns a cumulative sum of sales from the beginning of the month until any given date defined by the current filter context.
You can also see that the accumulation restarts at the beginning of every month.
As for the Total row, the TOTALMTD returns the month-to-date value of the last month in the date column.
Calculate Month to Date Using DATESMTD
The DATESMTD function returns a single-column date table containing all dates from the beginning of the month up to the current date that is defined by the filter context. The function takes only one argument and has its syntax as follows:
DATESMTD ( <Dates> )
EVALUATE
DATESMTD ( 'Date'[Transaction_Date] )
For instance, running this syntax in DAX Studio returns all the dates in April 2019.

MTD (DATESMTD) =
    CALCULATE (
        [Sales],
        DATESMTD (
            'Date'[Transaction_Date]
        )
    )
To retrieve the MTD sales value using the DATESMTD function, you can use this syntax. This syntax is just another way of writing the TOTALMTD syntax.
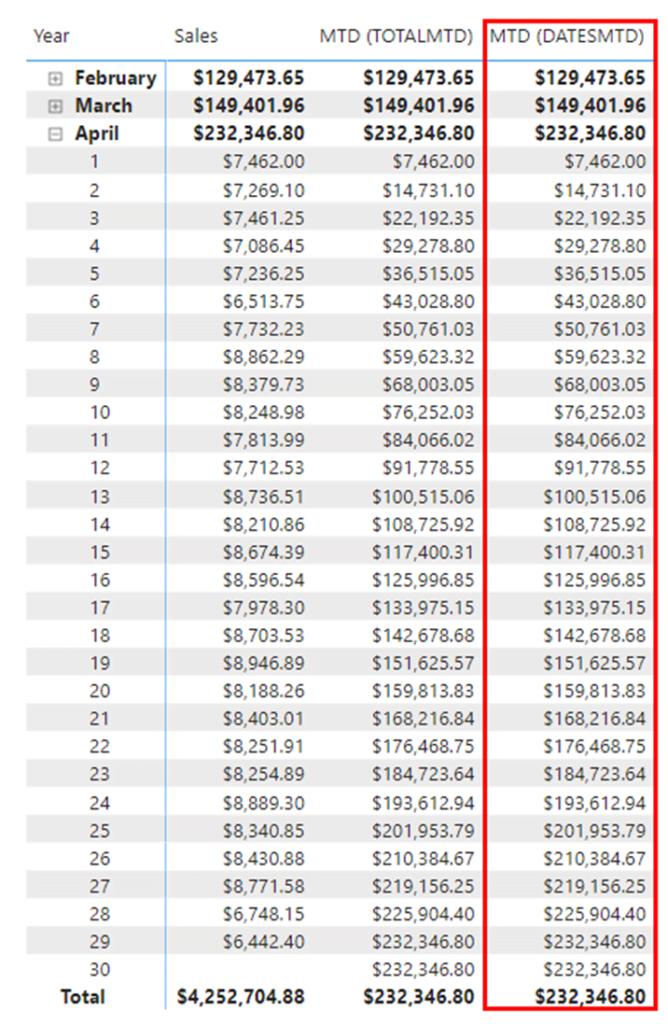
Since the MTD (DATESMTD) and MTD (TOTALMTD) measures are equivalent, they will return identical results when displayed in a visual.
Despite returning the same values, TOTALMTD and DATESMTD functions are not interchangeable. The TOTALMTD function returns a scalar value, while the DATESMTD function returns a single-table date column.
For this reason, the DATESMTD function is an optimal filter in a CALCULATE expression. That is why the MTD (DATESMTD) and MTD (TOTALMTD) measures can return the same values in this visual.
Calculate Month to Date Using DATESINPERIOD
The DATESINPERIOD is another time intelligence tool you can use to return MTD calculations. DATESINPERIOD returns a single-table date column containing dates that begin on the specified start date and continue – backward or forwards – for the specified interval duration.
The DATESINPERIOD uses three parameters and has its syntax as follows:
DATESINPERIOD ( <Dates>, <StartDate>, <NumberOfIntervals> )<Dates>– a column containing dates.<StartDate>– depending on whether the interval’s value is positive or negative, this parameter may represent either the start or end date of the period.<NumberOfIntervals>– a positive or negative number that specifies the interval to use for the period. When<NumberOfIntervals>is negative, the dates are counted backwards from<StartDate>. Conversely, if<NumberOfIntervals>is positive, the dates are counted forward from<StartDate>.<Interval>– specifies the unit of time to use. This could be set to Year, Quarter, Month, or Day.

EVALUATE
DATESINPERIOD (
    'Date'[Transaction_Date],
    1 / 1 / 2017,
    14,
    DAY
)
For example, when you run this syntax in DAX Studio, it returns a 14-day period which begins on the 1st of January 2017.

MTD (DATESINPERIOD) =
    CALCULATE (
        [Sales],
        DATESINPERIOD (
            'Date'[Transaction_Date],
            MAX (
                'Date'[Transaction_Date]
            ),
            -1,
            MONTH
        )
    )
This expression will return the MTD sales value.
Here’s a break-down of the syntax to understand how it works:
1. CALCULATE – this function modifies the context in which the measure is evaluated by applying one or more filter expressions.
2. [Sales] – this represents the measure you want to evaluate.
3. DATESINPERIOD(‘Date’[Transaction_Date], MAX(‘Date’[Transaction_Date]), -1, MONTH) –This generates the date table within a specified period.
- The
'Date'[Transaction_Date]is the date column in the data model. MAX('Date'[Transaction_Date])finds the maximum (latest) transaction date in the date table. It serves as the starting point for the MTD calculation.-1determines the number of intervals the DATESINPERIOD function should use. It effectively gives the MTD range.MONTHspecifies the unit of time to use for the intervals.
By using this expression, you will obtain the MTD value of the specified measure.

When you add the measure to the visual, you can see that it returns the same value as the previous MTD (TOTALMTD) and MTD (DATESMTD) measures.

Note that when using the DATESINPERIOD function, MTD values are not reset at the end of each month. Instead, values continue to accumulate based on the monthly interval defined in the syntax.
While the values may appear similar initially, there is a divergence at the end of the first month. That is because DATESINPERIOD evaluates an expression based on a set period. In contrast, TOTALMTD and DATESMTD compute expressions for each day of the month.
As such, it’s best to avoid using the DATESINPERIOD function if you want to see the MTD calculation for every day of the month.
If otherwise, you can see this alternative syntax that uses the ENDOFMONTH function in place of the MAX function.

MTD (DATESINPERIOD) =
    CALCULATE (
        [Sales],
        DATESINPERIOD (
            'Date'[Transaction_Date],
            ENDOFMONTH (
                'Date'[Transaction_Date]
            ),
            -1,
            MONTH
        )
    )
By using the ENDOFMONTH function instead of the MAX function, only the last day of each month will be recognized. Therefore, only values for the last days of the month will be evaluated.

Since only the last day of each month is recognized, the MTD value is forced to reset at the beginning of each month. This value is then repeated for every date in the month because they’re not recognized.
Calculate Month to Date Using DATESBETWEEN
The DATESBETWEEN function returns a single column containing the date values between two dates. For this reason, it’s perfect for calculating MTD values.
The DATESBETWEEN function syntax uses three parameters:
DATESBETWEEN ( <Dates>, <StartDate>, <EndDate> )<Dates>– a column containing dates or an expression that returns a single-column date table.<StartDate>– the start date of the period. It’s inclusive, that is the period starts on the date specified in the<StartDate>parameter. If blank,<StartDate>will be the earliest date in<Dates>.<EndDate>– the end date of the period. It’s inclusive, that is the period ends on the date specified in the<EndDate>parameter. If blank,<EndDate>will be the latest date in<Dates>.
DATESINPERIOD will return an empty table if the <StartDate> is larger than the <EndDate>.

EVALUATE
DATESBETWEEN (
    'Date'[Transaction_Date],
    DATE ( 2017, 1, 1 ),
    DATE ( 2017, 1, 5 )
)
If you run this code in DAX Studio, it will return the date of the first five days in January 2017.

MTD (DATESBETWEEN) =
    CALCULATE(
        [Sales],
        DATESBETWEEN(
           'Date'[Transaction_Date],
            STARTOFMONTH (
                'Date'[Transaction_Date]
            ),
            MAX (
                'Date'[Transaction_Date]
            )
        )
    )
This expression calculates the sales MTD value using the DATESBETWEEN function. Let’s break it down to understand how it works:
1. CALCULATE – this function changes the context in which the measure is evaluated by applying one or more filter expressions.
2. [Sales] – this represents the measure you want to calculate.
3. DATESBETWEEN`('Date'[Transaction_Date], STARTOFMONTH('Date'[Transaction_Date]), MAX('Date'[Transaction_Date]) – this function generates a table of dates between the specified start and end date.
'Date'[Transaction_Date]– this is the column containing dates in the data model.STARTOFMONTH('Date'[Transaction_Date])– this part of the expression finds the start of the month for each transaction date in the date table. It ensures that the MTD calculation starts from the beginning of the month.MAX('Date'[Transaction_Date])– this part of the expression finds the maximum (latest) transaction date in the date table. It serves as the end date for the MTD calculation.

By using the DATESBETWEEN function with the STARTOFMONTH function driving the <StartDate> parameter and the MAX function driving the <EndDate> parameter, the syntax creates a table of dates that begins on the first day of the month and ends on the last day of the month.
Crucially, this means the MTD values for the measure restart at the beginning of every month while also returning the daily MTD values for each day in the month.
As you can see in this visual, the MTD values when using the DATESBETWEEN function are very similar to the other measures that used the TOTALMTD and DATESMTD functions.
Conclusions
Understanding how to calculate Month-to-Date (MTD) values in Power BI using functions like DATESINPERIOD, DATESBETWEEN, DATESMTD, and TOTALMTD is crucial for effective data analysis and monitoring of performance within a specific period.
Although TOTALMTD and DATESMTD functions are more efficient for MTD calculations, using the DATESBETWEEN function has its benefits. It allows you to specify your desired start and end date, perfect for when traditional date systems don’t match your MTD calculation needs.
And even though you can’t customize start and end dates using the DATESINPERIOD function, it enables you to remove data from the visual that you’re not interested in. This can help you to focus on the important stuff.
No matter which functions you choose, you can use it to flexibly and precisely define the MTD range and calculate cumulative values. These functions also allow you to extract valuable insights, track trends, and make informed business decisions based on real-time data analysis.


0 Comments